Table of Contents
As a creator, there’s a unique joy in seeing people actively using and appreciating the things you create. In my case, it’s a bot that I had developed for Discord servers; a small side-hobby which has expanded over the years.
Journey from a Hobby to a Large-Scale Operation
My bot, named T4, started its journey with Discord.py library on a humble netbook with only 1GB of RAM. It quickly graduated to a Raspberry Pi 2, with 1GB RAM and slower. While the Raspberry Pi might have been slower, it allowed me to keep T4 online 24/7, a massive improvement.
Seeing T4 grow and being utilized by increasing numbers of people, I had to upgrade to a more capable server on Google Compute Engine. Today, as the bot continues to expand, it operates on an n1-standard-2 server with 8GB of RAM, which, while being more costly, enables the bot to function seamlessly.
Analysis of Resource Usage
Given my penchant for analyzing graphs, I started noticing that T4 had been consuming more than expected RAM. This sparked my curiosity and led me to investigate further.
Below is a graph showing the RAM usage of the entire server.
(The spikes appearing in there are beause I restarted the server two times.)
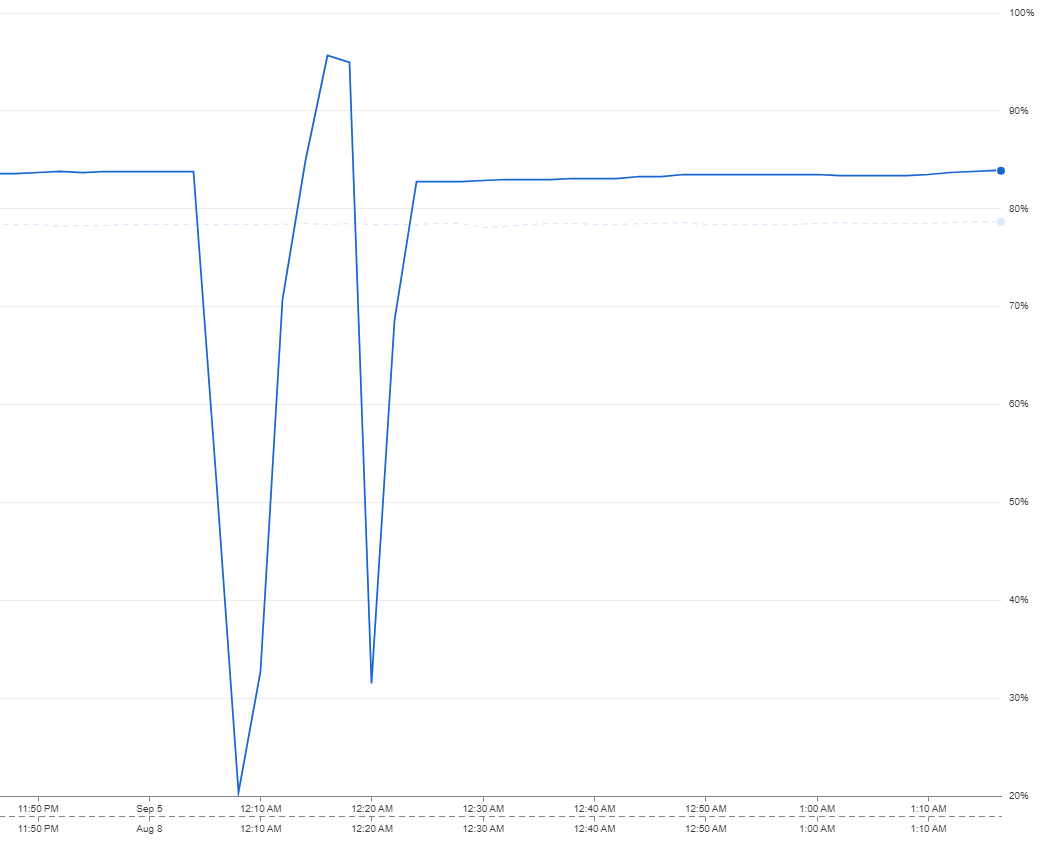
As shown in the graph, the server was using more than 80% of the available RAM. Using system resource management tools like htop, I could determine that approximately 5GB of RAM was being consumed by the bot alone. This got me thinking – was there a memory leak, or was the bot just growing to a size where this kind of RAM usage was to be expected?
Debugging and Discovering the Memory Usage
With T4 now a part of over 12,000 servers, debugging seemed like the next logical step. The ability to get process names by hovering over the graphs triggered a thought: could this indeed be made possible to change for each shard in my Discord bot? To my surprise, it was possible, thanks to a Python module named setproctitle.
A closer examination revealed that one particular shard was consuming significantly more RAM than the rest – over 2GB, to be specific. That’s more than six times the 300MB average each shard typically consumes.
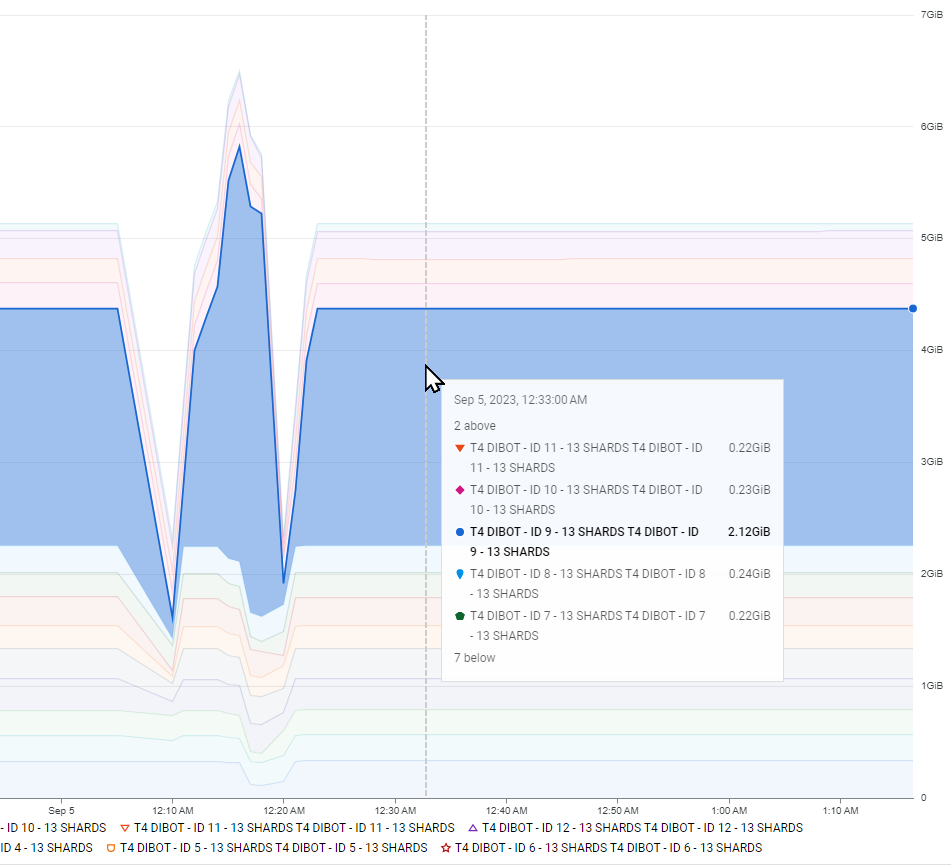
Interestingly, when I rechecked the stats without the member’s intent factored in, each server was averaging around 300MB. So, the spike had something to do with the members. But what could be causing such a drastic increase in RAM usage on just one shard?
BlueWillow’s Guild: The Culprit
As I delved deeper into the mystery, I stumbled upon BlueWillow’s guild, one of the immense Discord servers, hosting over 2 million members.

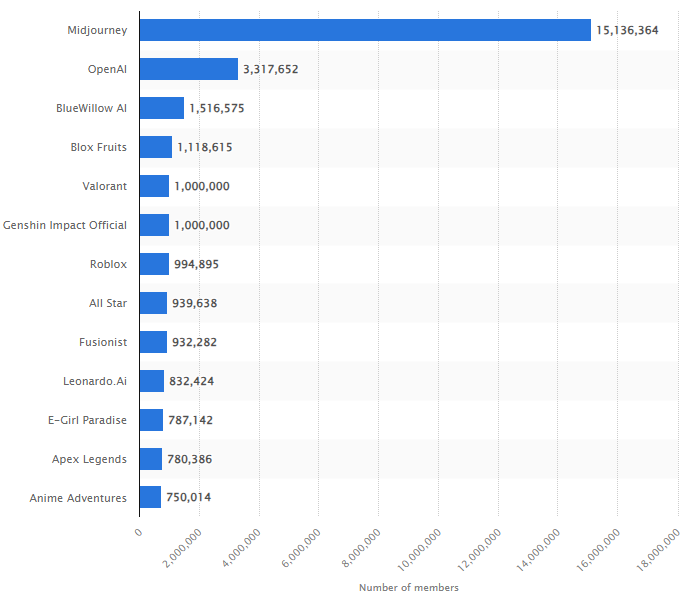
My initial reaction was disbelief, but further investigation disclosed the magnitude of BlueWillow’s footprint. According to a Statista report, as of May 2023, BlueWillow was on the list of top most populated Discord servers, ranking 3rd with 1.5 million members.
Indeed, my bot T4, just like BlueWillow, was growing at an exceptional pace, and by May 2023, T4 was listed among the most popular servers in the world.
Understanding the interaction between T4 and the Discord servers, particularly the large ones like BlueWillow, brought to light the fascinating dynamics of server management on such a grand scale. It unveils the interesting challenges and opportunities that arise while managing bots in large servers. I can’t wait to see where this exciting journey takes me next!
How did you create the graph for “Server RAM GiB usage for shard processes”? Can you please share how you integrated the module you mentioned with discord.py and which tool created the graph. Thank you.
Each shard of the bot is running in a separate process using Python’s multiprocessing library. As soon as the process starts, I set it a process name using the setproctitle module.
I’m using Compute Engine by Google Cloud to host the bot. You can see a dashboard of every virtual machine you have in there.
Google Cloud automatically logs all your processes info, so I can see the graph you can see in the post.
If you want further explanation, tell me, and I can do a tutorial.